One Step Plasma Separation from Whole Blood

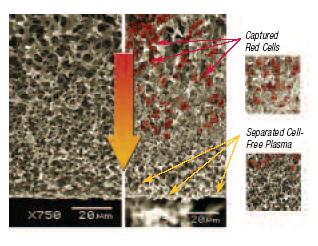
Integral to molecular diagnostic operations is the generation of high quality plasma from whole blood samples. The Vivid Plasma Separation membrane utilizes a patented process where a highly asymmetric membrane is specifically engineered for the generation of plasma from whole blood. The highly asymmetric nature of the membrane allows the cellular components of the blood (red cells, white cells, and platelets) to be captured in the larger pores without lysis, while the plasma flows down into the smaller pores on the downstream side of the membrane. The rapid separation process yields plasma similar in HPLC and SDS PAGE profiles to traditional centrifuged plasma in less than two minutes.
Non-specific binding of clinically relevant biomarkers is a concern when working with porous materials in diagnostic applications. Whole blood processed through the Vivid Plasma Separation membrane has shown equivalent 2DE protein profiles for the cardiac biomarker Troponin I as compared to centrifuged plasma. These data indicate that the protein concentration of clinical biomarkers is not reduced when processed through the membrane making it an ideal material for diagnostic applications.
One Step Separation of Plasma from Whole Blood Without Centrifugation Using Vivid Plasma Separation Membrane
Products in this datasheet may be covered by one or more patents including US 6,045,899; US 5,906,742; US 6,565,782; US 7,125,493; US 6,939,468; EP 0,946,354; EP 0,846,024; US 6,440,306; US 6,110,369; US 5,979,670; US 5,846,422; US 6,277,281; EP 1,118,377; EP 0,696,935; EP 1,089,077.
Typical Membrane Characteristics
| Base Material | Grade | Thickness (mils) | Thickness (µm) |
| Asymmetric polysulfone | GF | 12.99 +/- 0.79 | 330 +/- 20 |
| Asymmetric polysulfone | GX | 12.99 +/- 0.79 | 330 +/- 20 |
| Asymmetric polysulfone | GR | 12.99 +/- 0.79 | 330 +/- 20 |
Typical Performance Characteristics
| Base Material | Grade | Blood Volume ( µ/cm2) | Membrane Void Volume | Plasma Separation Time (sec) | Plasma Recovery (%) | Applications |
| Asymmetric polysulfone | GF | 20 | 1X | < 2 minutes | > 60 | Small blood volume applications, such as finger sticks in formats like microfluidic and lateral flow POC devices. No post-treatment so material may exhibit higher hemolysis levels than other grades. |
| Asymmetric polysulfone | GX | 20-30 | 1-1.5X | < 2 minutes | > 60 | Small blood volume applications, such as finger sticks in formats like microfluidic and lateral flow POC devices. Also compatible with electrochemical analyte detection. Post-treatment helps to minimize hemolysis. |
| Asymmetric polysulfone | GR | 40-50 | 2-2.5X | < 2 minutes | > 80 | Large blood volume applications, such as lateral flow immunochromatographic devices. Post-treatment facilitates larger blood volumes with lower hemolysis. |
Note: The product performance characteristics outlined above are determined using EDTA collected whole blood with typical hematocrit content of 45.6%. It is important to ensure that the membrane lies flat, that no end contact occurs, and to seal the edges by compression, etc. In addition, the underlying material has enough capillary force to wick the plasma from the membrane.
Note: The sample blood volume capacity of Vivid Plasma Separation membrane is defined as the amount of whole blood per cm2 of medium that is rapidly and consistently separated (< 2 minutes) by the medium with low hemolysis. Blood volume capacity of the medium is directly related to its void volume (e.g., the space within the solid phase of the medium that is occupied by a liquid sample). The calculated void volume of Vivid Plasma Separation membrane is ~20 ± 1 µ/cm2. With knowledge of the void volume within Vivid Plasma Separation membrane, and the specific membrane post-treatments utilized, we express recommended blood volume capacities that generate rapid and consistent plasma separation with minimal hemolysis. It is essential that these blood sample volume recommendations are followed in order to achieve optimal conditions for the preparation of quality plasma.
Applications
- Plasma generation from whole blood
- Lateral flow diagnostics
Sealing
- Mechanical
- Adhesive
- Lamination
Achieve High Plasma Yields with Vivid Plasma Separation Membrane
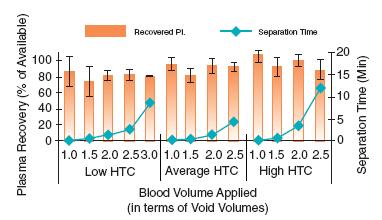
Plasma recovery (in percent of available plasma) is presented as orange columns (values are to be read at the left Y-axis) against the volumes of blood applied to the Vivid Plasma Separation GR membrane (shown on X-axis in void volume increments; one void volume is equal to 20 µ of blood). One can see that the percent of plasma recovered from different volumes of blood does not depend on the blood volume applied to the media. Separation times are plotted as teal rhombs with values read at the right Y-axis. The graphs show that the separation time increases dramatically with increasing blood volume applied to the media.
Low Hemolysis with Vivid Plasma Separation Membrane
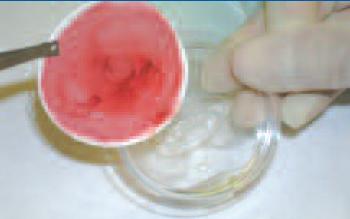
A 47 mm disc of Vivid Plasma Separation Membrane was placed flat on the bottom of a small petri dish. 600 µ of fresh whole EDTA blood was applied to the disc and separation was completed in approximately 6 minutes. Each disc was carefully slid along the bottom of the petri dish to access the plasma. Plasma was pooled at the edge of the dish and used for immediate total protein, cell, and hemoglobin measurements. The resulting plasma has been demonstrated as cell and hemolysis free.
Vivid Plasma Separation Membrane Does Not Bind Clinically Relevant Protein Biomarkers from Plasma Samples
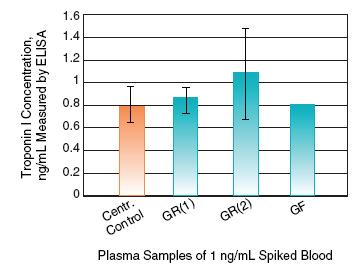
Troponin I concentration was measured in plasma samples filtered through Vivid Plasma Separation membrane (blue columns) versus control centrifuged plasma (orange column). All plasma samples were generated from the same sample of fresh EDTA blood spiked with Troponin I at 1 ng/mL. Protein concentration in each sample was measured in triplicate.
No Significant Difference in the Protein Profiles of Vivid Plasma Separation Filtered Plasma and Control Centrifuged Plasma
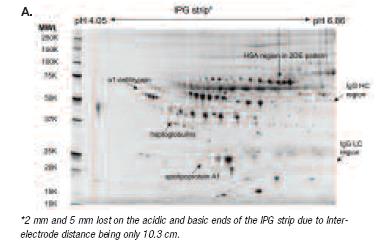
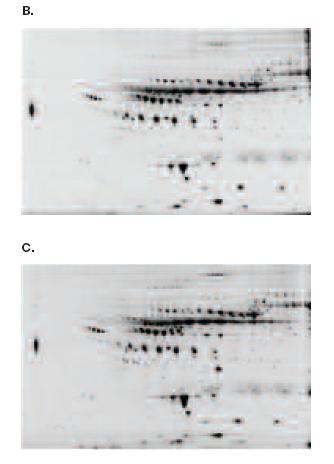
A 2DE protocol of very high resolution of the acidic pI, medium molecular weight region where most of the known cardiac biomarkers are located, employed a first dimension with pH 4-7 NL IPG strips followed by second dimension separation on 10.5-14% SDS PAGE. 2DE profiles of control centrifuged plasma (Picture A) and Vivid Plasma Separation membrane separated plasma (Pictures B and C) are presented. There is no significant difference between the Vivid Plasma Separation separated plasma and the centrifuged control plasma.
- White Blood Cell Isolation Medium isolates leukocytes from whole blood samples. The nucleic acid content can be extracted for further analysis in molecular detection applications.
Custom roll, sheet, and disc sizes available upon request. Please contact your local sales representative for additional information.
| Part Number | Description | Pkg |
| T9EXPPA0200S00A | Vivid Plasma Separation GF membrane, 8" x 11" sheet | 1/pkg |
| T9EXPPA0200S00X | Vivid Plasma Separation GX membrane, 8" x 11" sheet | 1/pkg |
| T9EXPPA0200S00R | Vivid Plasma Separation GR membrane, 8" x 11" sheet | 1/pkg |
Earn 10% off* your next order online by leaving a review of this product. Please login to your account to leave a review. We appreciate and value your feedback.
*Subject to Terms and Conditions.


